Guidelines vs. Financial Incentives Against Low-Value Care: Which Policy Tool Actually Changes Physician Behavior?
Lessons from Switzerland’s Vitamin D case
Swiss natural experiment reveals financial incentives reduced unnecessary vitamin D testing by 60% while clinical guidelines achieved only 6% reduction. Analysis of 3,600+ physicians shows policy implications for healthcare systems worldwide.
Author
Aurélien Sallin
Published
October 20, 2025
Keywords
low-value care, health policy, vitamin D testing, Switzerland healthcare, interrupted time series, choosing wisely, health economics
Code
library(ggplot2)library(dplyr)library(readr)library(qs)dataGraph <-qread("data/dataGraph.qs")dfgraph <- dataGraph$dfGraph_longcounterfactualM <- dataGraph$counterfactual_longout <- dataGraph$outdfgraph <-rename(dfgraph, "y"= y1_)plot_vitd_masked <-function( dfgraph, counterfactualM,mask_from =NULL,mask_counterfactual_from =NULL,x =0.8) {# Filter data based on mask_from parameter instead of using rectangles dfgraph_filtered <-if (!is.null(mask_from)) {subset(dfgraph, time <= mask_from) } else { dfgraph }# Create counterfactual dataframe counterfactual_df <-data.frame(time = dfgraph$time,counterfactual = counterfactualM )# Filter counterfactual data if neededif (!is.null(mask_counterfactual_from)) { counterfactual_df <-subset(counterfactual_df, time <= mask_counterfactual_from) }# Filter counterfactual by mask_from as wellif (!is.null(mask_from)) { counterfactual_df <-subset(counterfactual_df, time <= mask_from) } p <-ggplot(dfgraph, aes(y = y *100, x = time)) +geom_line(data = dfgraph_filtered,aes(color ="Observed",size ="Observed",linetype ="Observed" ) ) +geom_line(data = counterfactual_df,aes(y = counterfactual *100,color ="Counterfactual",size ="Counterfactual",linetype ="Counterfactual" ) ) +geom_line(data =subset(dfgraph_filtered, time <=0),aes(y = pred *100,color ="Predicted",size ="Predicted",linetype ="Predicted" ) ) +geom_line(data =subset(dfgraph_filtered, time >=0),aes(y = pred *100,color ="Predicted",size ="Predicted",linetype ="Predicted" ) ) +scale_linetype_manual(name ="",values =c("Observed"=1, "Predicted"=1, "Counterfactual"=4) ) +scale_size_manual(name ="",values =c("Observed"= x *0.8,"Predicted"= x *1,"Counterfactual"= x *1.25 ) ) +scale_color_manual(name ="",values =c("Observed"="grey40","Predicted"="#E22920","Counterfactual"="#01BBA8" ) ) +scale_x_continuous(limits =c(-50, 18),breaks =c(-50, -39, -27, -15, -3, 0, 9, 15, 21) -15,labels =c("Jan.\n2017","Jan.\n2018","Jan.\n2019","Jan.\n2020","Jan.\n2021","Apr.\n2021","Jan.\n2022","Jun.\n2022","Jan.\n2023" ) ) +scale_y_continuous(limits =c(1.5, 7),breaks =seq(2, 7, 1) ) +annotate("rect",xmin =-28,xmax =-24,ymin =-Inf,ymax =Inf,alpha =0.1,fill ="#00857C" ) +geom_text(aes(x =-26, y =1.8, label ="COVID19 \nLockdown"),color ="#00857C",size = x *3 ) +labs(y ="Monthly Vitamin D test prescriptions per 100 consultations",x =NULL ) +theme_classic() +theme(plot.background =element_rect(fill ="#F5F5F5", color =NA),panel.background =element_rect(fill ="#F5F5F5", color =NA),legend.background =element_rect(fill ="#EEEEEE"),legend.position ="bottom",panel.grid.major.x =element_line(color ="white"),panel.grid.major.y =element_line(color ="white"),axis.text.x =element_text(size = x *10),axis.text.y =element_text(size = x *10),axis.title =element_text(size = x *11),legend.text =element_text(size = x *10) )# Add vertical lines conditionally based on data support# Only add vline if the x-intercept is within the data range (mask_from)if (is.null(mask_from) || mask_from >=-15) { p <- p +geom_vline(xintercept =-15,color ="#E22920",lty =20,linewidth = x *1.5 ) }if (is.null(mask_from) || mask_from >=0) { p <- p +geom_vline(xintercept =0,color ="#675482",lty =20,linewidth = x *1.5 ) } p}
Our Research Question: How can healthcare systems effectively reduce low-value care that wastes millions in resources?
Our Natural Experiment: Switzerland tried two different approaches in the case of prescription of Vitamin D tests: clinical guidelines vs. financial restrictions. We tracked what actually happened to the number of prescriptions.
Health systems continue to face the problem of low-value care, i.e. services that bring limited benefit to patients while adding costs and administrative effort. Vitamin D testing has become a prominent example.
Although clinical guidelines consistently advise against routine testing for low-risk individuals, the use of these tests has continued to rise in many countries. In Switzerland, testing rates almost doubled between 2013 and 2020, from 96 to 199 tests per 1000 inhabitants.
A Policy Response
This increase led to several policy measures. In April 2021, the Smarter Medicine initiative, which is the Swiss equivalent of Choosing Wisely™, included vitamin D testing in its list of procedures to avoid. The recommendation was simple: no routine measurement of 25(OH)-Vitamin D in patients without risk factors. Physicians were informed of these measures.
A year later, the Federal Office of Public Health introduced a coverage restriction (limitatio), limiting reimbursement for such tests. Together, these steps offered a natural experiment to observe how clinical recommendations and financial incentives influence medical practice.
Using Real-World Data to Evaluate the Effect
To examine these changes, we analyzed mandatory health insurance claims data from SWICA, covering about 10% of the Swiss population. The data include more than 3’600 general practitioners and group practices, with adult patients who had at least one consultation between 2018 and 2023.
We applied interrupted time-series analysis to estimate how testing volumes evolved around the two interventions. The method compares observed data with a counterfactual trend, which shows what we would expect if the interventions had not taken place.
The models account for patient characteristics, clinical indications for testing based on Swiss guidelines, and physician-specific prescribing behavior. This allows us to isolate the effect of the policy interventions from broader temporal or compositional changes.
A Multi-Disciplinary Collaboration
This study is the result of a productive collaboration between the health services research team at SWICA, physicians at the Institute of Primary Care of the University of Zürich, and health economists at the Institute of Health Economics and Health Policy of the Bern University of Applied Sciences.
This collaboration demonstrates how insights from claims data can advance our understanding of the healthcare system and inform policy decisions aimed at reducing costs for the Swiss population.
The results in one scroll
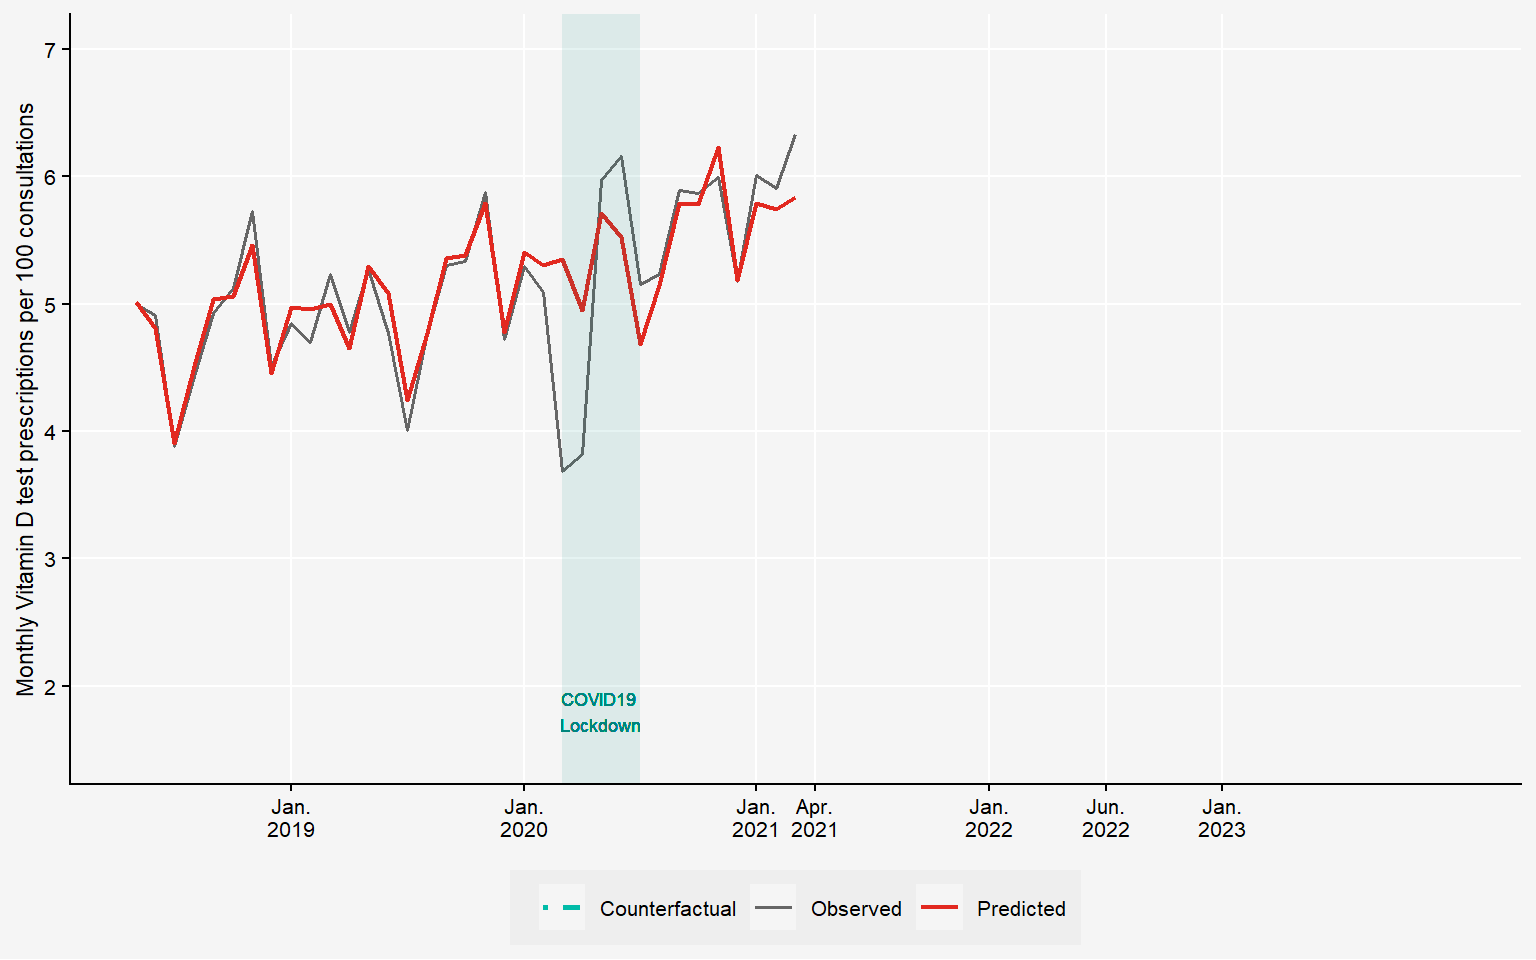
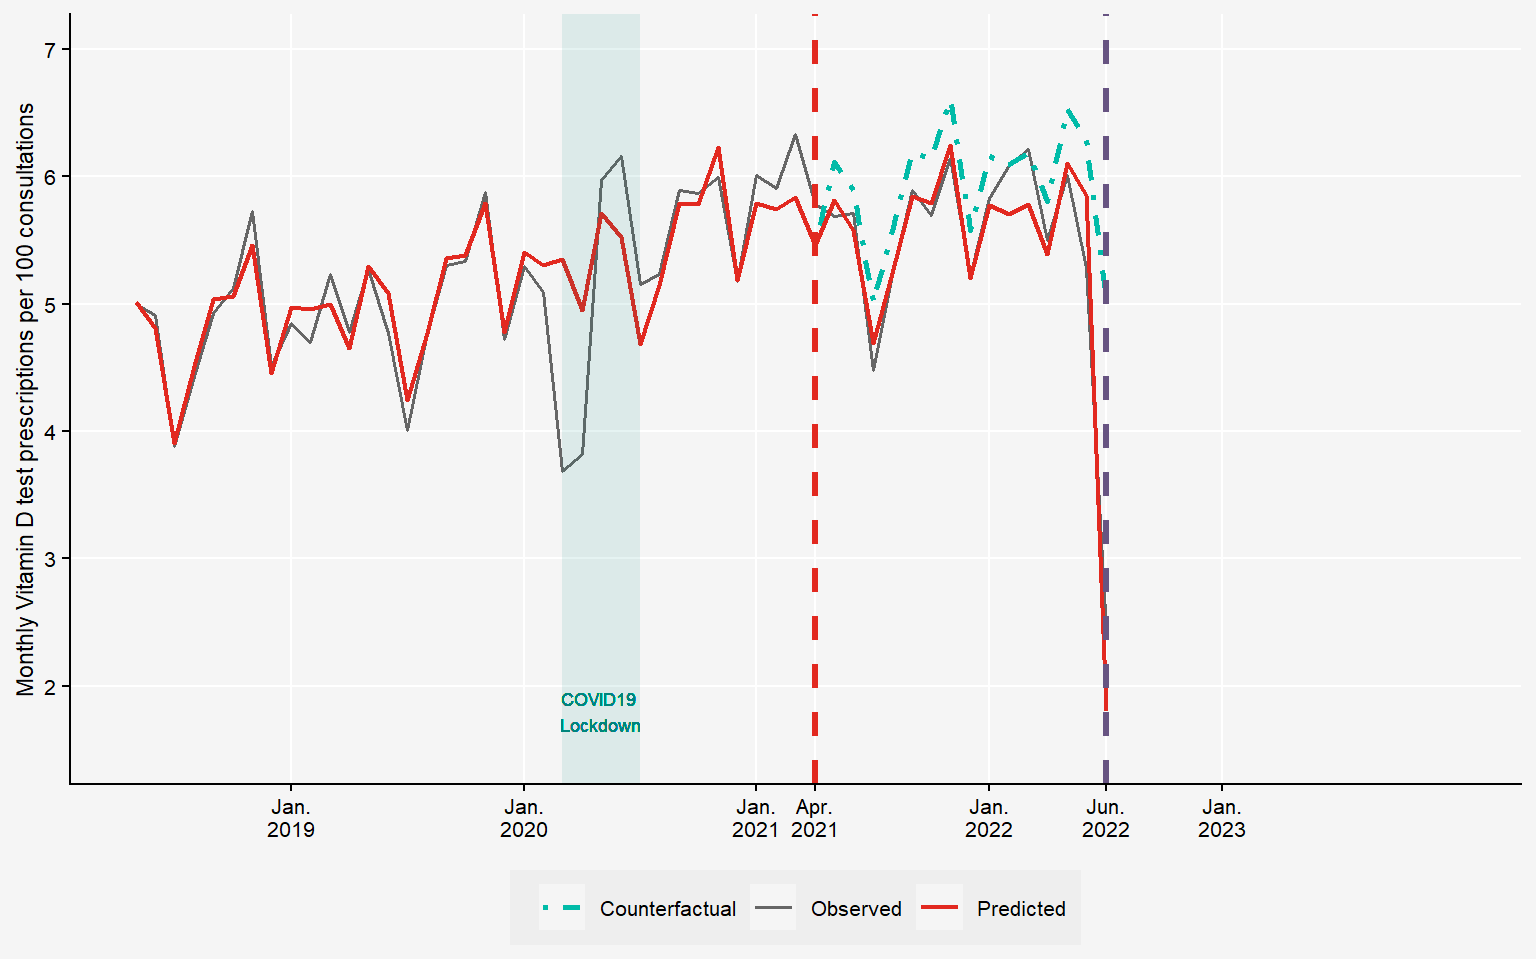
Reading the Chart: What Are We Looking At?
●●●Grey line = Actual vitamin D tests prescribed each month (real SWICA data) ●●●Red line = What our statistical model predicts should happen ▬▬▬Green box = COVID-19 lockdown period (March-April 2020) Why this matters: The red and grey lines track closely together, showing our model accurately captures normal prescribing patterns. This means we can detect when policies actually change physician behavior.
Vitamin D Test Prescriptions Rose Despite Low-Value Status
Despite clear evidence of low clinical value, vitamin D test prescriptions rose by 20% between 2018 and 2021.
A textbook example of low-value care in the healthcare system (see also Obsan 2023).
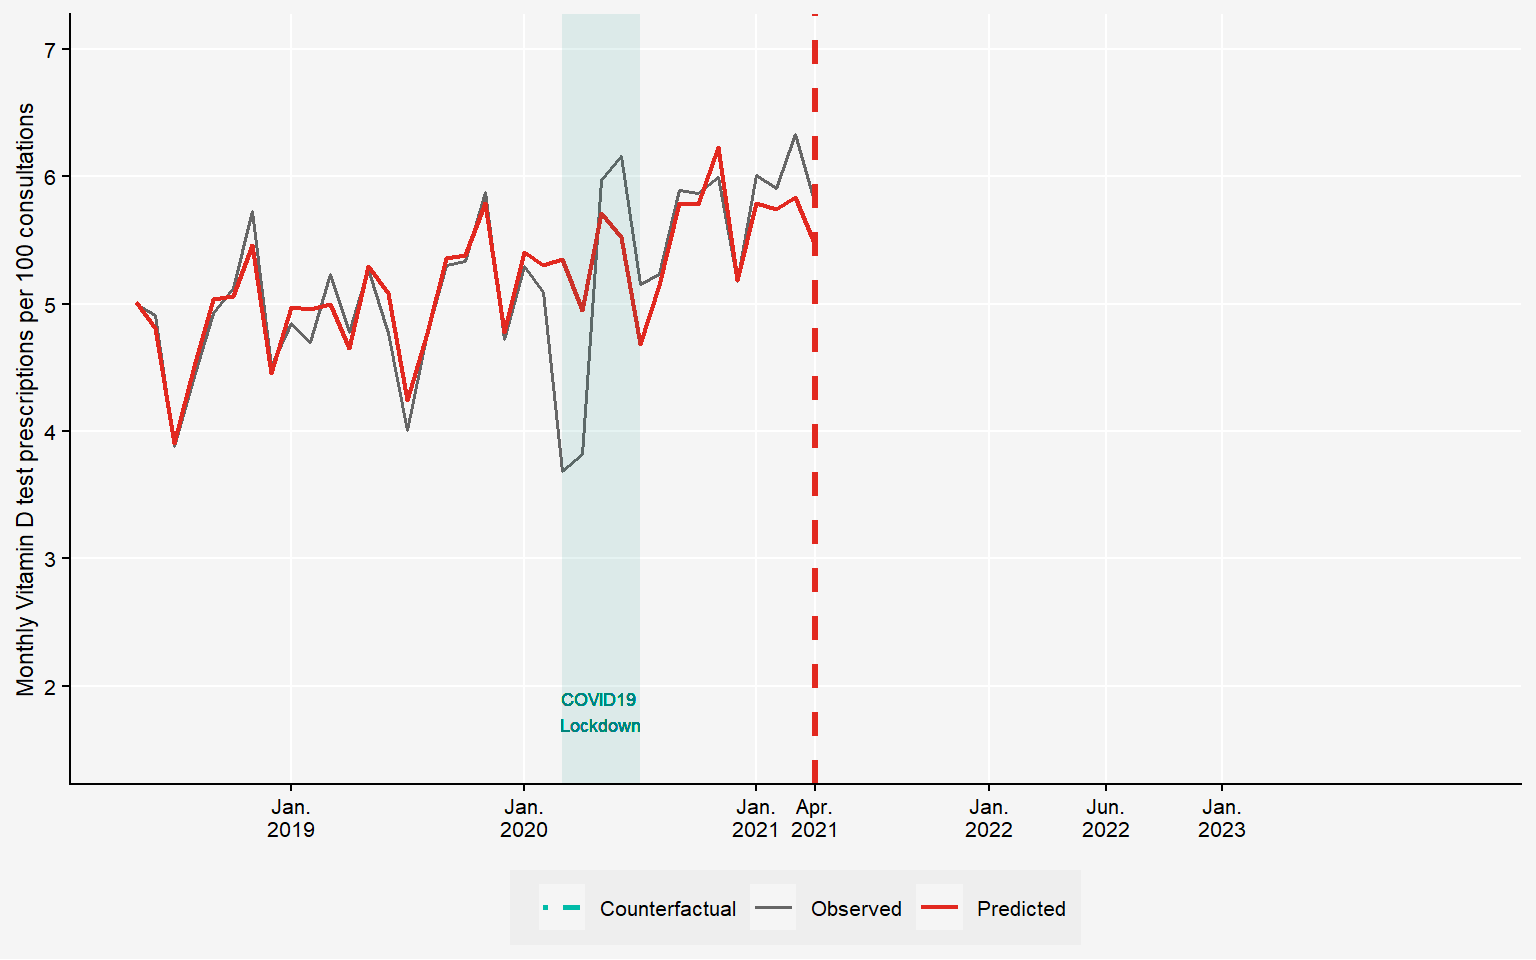
April 2021: Smarter Medicine Takes Action
Switzerland’s Choosing Wisely™ campaign places vitamin D testing on their “Top 5” list of unnecessary procedures.
Clear message: “No routine testing for patients without risk factors.”
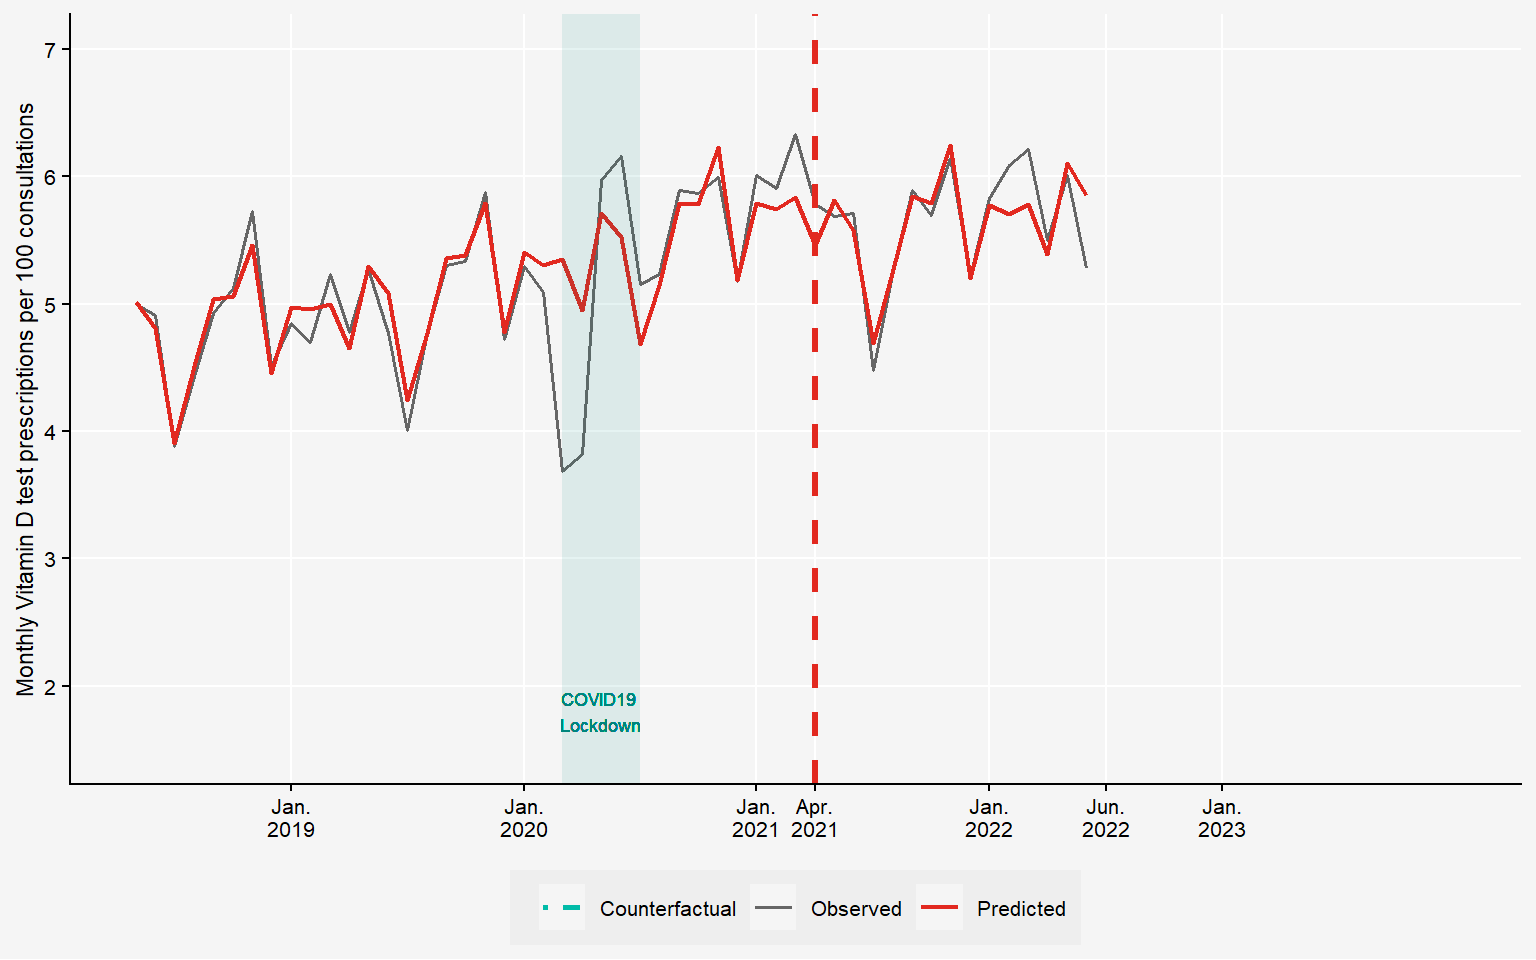
Clinical Recommendations: Modest Impact
The Smarter Medicine recommendation shows a slight downward trend.
But is this enough? Let’s compare with what would have happened without intervention…
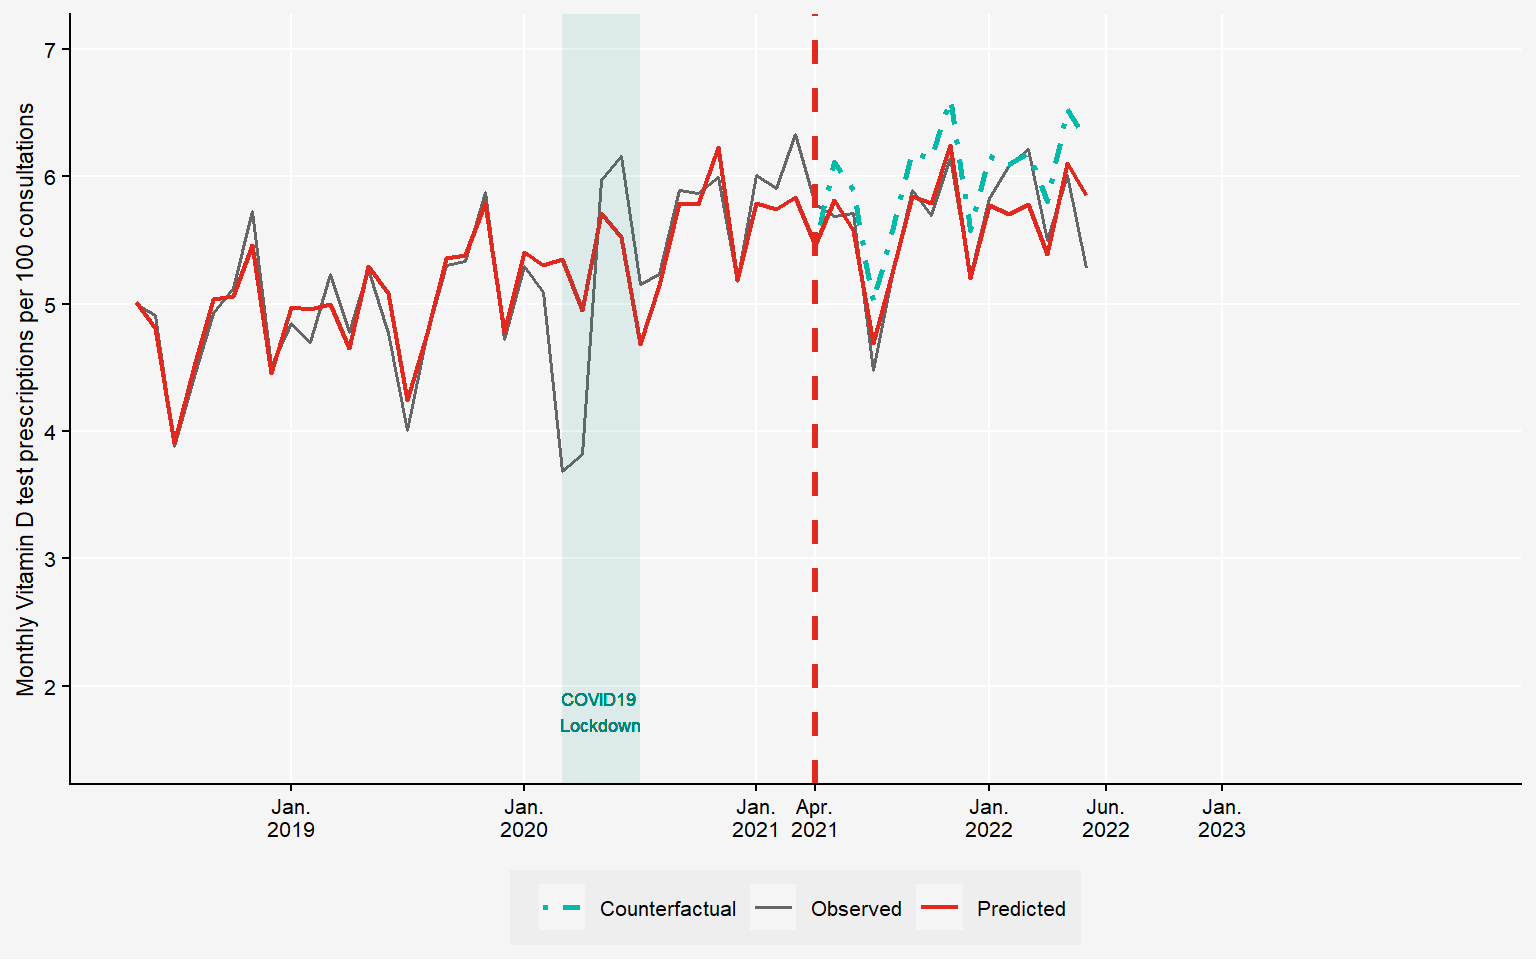
Revealing the Counterfactual
The teal dashed line shows what would have happened without the recommendation.
Testing rates would have continued climbing upward.
The Numbers: Clinical Recommendations Work, But Modestly
We conduct statistical tests to see whether the recommendation led to a recognizable pattern. The number of tests per consultation falls by 5.98% in the 12 months following the recommendation.
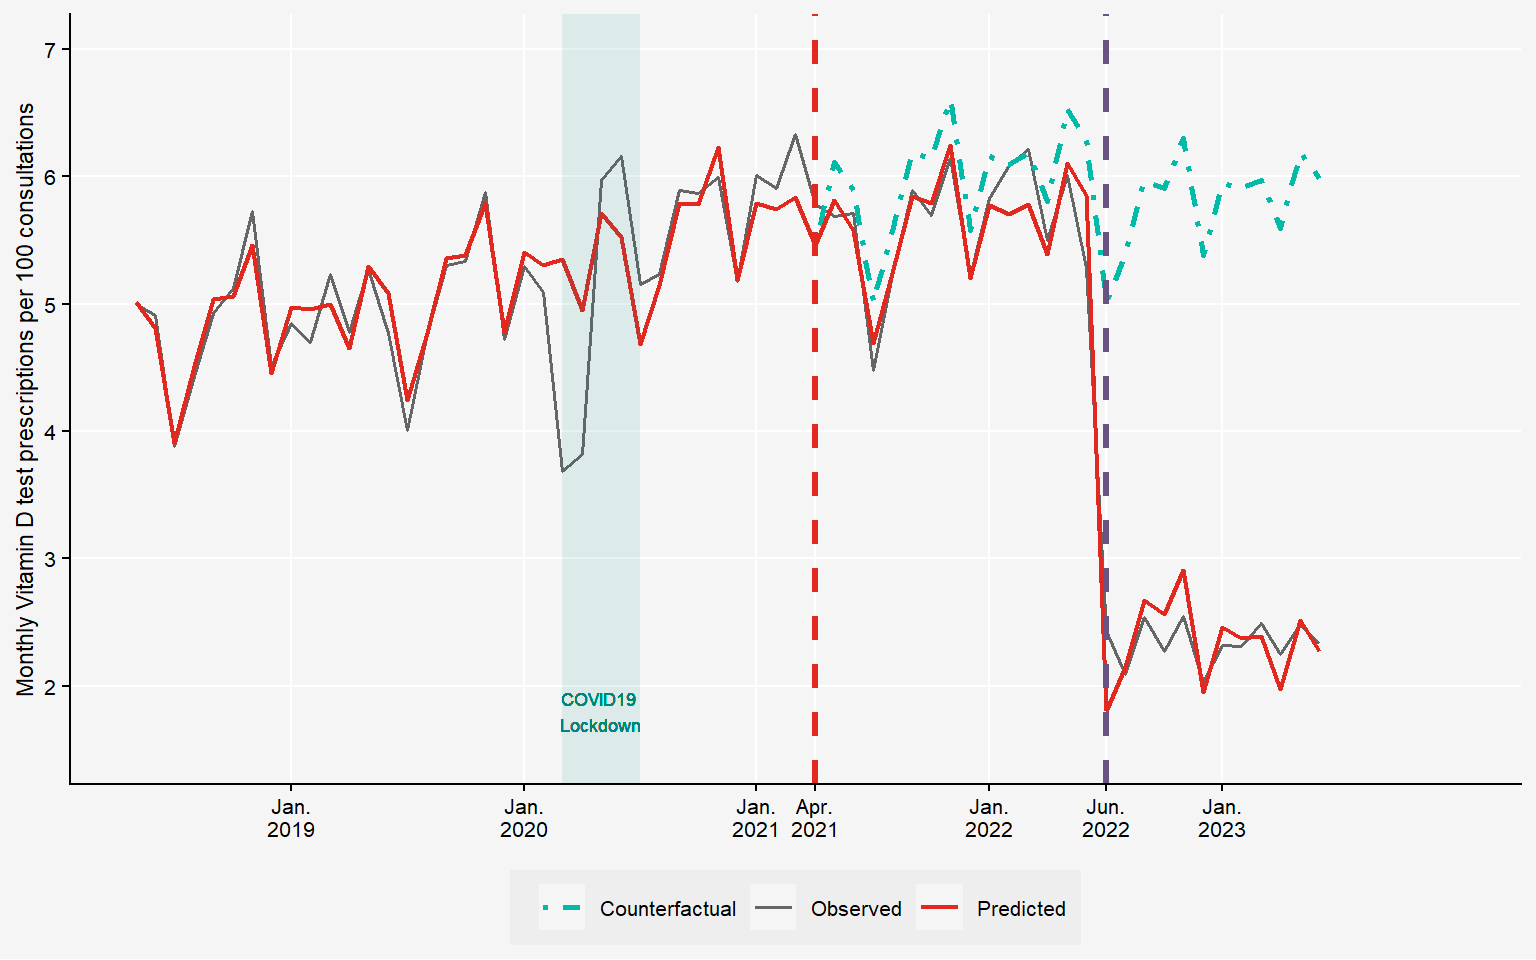
July 2022: Strong Regulatory Measure
The Federal Office of Public Health restricts coverage. Patients now pay out-of-pocket for routine tests.
Financial Incentives: The Game Changer
The number of tests per consultation drops by 57.82% in the 6 months following the coverage restriction. This is a dramatic drop compared to clinical recommendations alone.
The Bottom Line: 15.65 Million CHF Saved
Healthcare system savings of 15.65 million CHF in 2022 alone.
Clinical recommendations alone proved less effective than government regulation in reducing low-value care in Switzerland. However, our analysis revealed important nuances.
We found no unintended consequences from the coverage limitation: vitamin D supplementation rates remained unaffected, suggesting the policy successfully targeted testing without compromising appropriate treatment.
However, from a health policy perspective, simply removing procedures from basic insurance coverage cannot be the default solution for addressing unnecessary treatments. This regulatory approach creates high administrative burden for physicians.
A more sustainable solution lies in strengthening financial incentives that align provider and payer interests. In Switzerland, this can be achieved through managed care contracts between physician networks and health insurers within alternative insurance models. These contracts establish quality standards while creating shared financial responsibility among physicians—encouraging appropriate care delivery without heavy-handed regulation.
References
Sallin, Aurélien, Daniel Ammann, Caroline Bähler, Tobias Müller, Stefan Neuner-Jehle, Oliver Senn, and Eva Blozik. 2025. “The Impact of Choosing WiselyTM Recommendations and Insurance Coverage Restrictions on the Provision of Low-Value Care: An Interrupted Time Series Analysis of Vitamin d Tests.”BMC Health Services Research 25 (1): 1359.